
Table of Contents
Whether you’re a seasoned graphic designer or completely unfamiliar with the notion, making an infographic may take time and effort. There are a number of things to keep in mind while designing an infographic, such as adhering to your organization’s branding standards and ensuring that the info presented is clear and simple.
Here in this article, we will tell you how to make an infographic about yourself in 7 steps. Also, you can use these steps to make an infographic about your business.
How to Make Your Own Personal Infographic in 7 Easy Steps?
The process of making an infographic about yourself :
1- Set Your Target Audience
You’ll wind up with a lot of unhappy people when you strive to satisfy everyone. The same is true with infographics; if you want to appeal to the widest possible audience, you risk boring almost everyone.
It’s crucial to consider your intended audience and others your infographic may turn off. The facts you use, the amount of slang and jargon you can get away with, the tone you adopt, and the amount of information you need to convey will all depend on your intended audience.
2- Create a Goal Statement
Without a specific purpose in mind, your visual will seem as diffuse as you have not given any thought to your target demographic. Your infographic’s structure will depend on its intended purpose.
The purpose of an infographic may vary. For instance, it can be a data report. It’s tedious to work with a spreadsheet. In contrast, an infographic may transform the same information into an engaging narrative. Infographics are a great way to quickly and visually communicate where you are and what needs to be done, whether submitting a progress report, updating your supervisor, or analyzing data.
3- Collect Your Data to Make an Infographic About Yourself
In a further step, check that the data you’ve collected backs up your hypothesis. Many individuals struggle to go beyond this point. Where can you get the useful data that forms the basis of an infographic? Where do you get the data if you want to provide it in an easily consumable format?
The easiest and most immediate option is your own business. There’s probably enough information to fill an infographic, whether it’s analytics, sales data, or standard operating procedures. The key is to check if you are allowed to utilize the information.
How to collect data to make an infographic about yourself?
Sometimes you can’t or don’t want to use data from inside your organization. Then hiring a data extractor is a great option for hunting for fascinating infographic data. They can discover information on everything from the most popular games on Google Play to basketball stats or even global warming.
Keep in mind that little is more when it comes to information collection. It’s tempting to impress people by showing them a massive amount of data, but this frequently backfires. They aren’t impressed by how amazing it appears; they’re just puzzled and leaving. We provide a pair of solutions:
- Provide enough info to gain an overview
- Focus on one piece of evidence and provide a thorough explanation
If you attempt to accomplish both at once, the resulting infographic slide will be overwhelming and confusing.
4- Select a specific Kind of Infographic
In general, your data will be laid up in accordance with the style of infographic you choose. Infographics may be broken down into a few distinct categories:
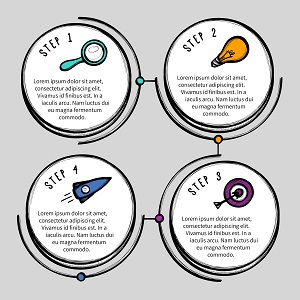
- Process infographics
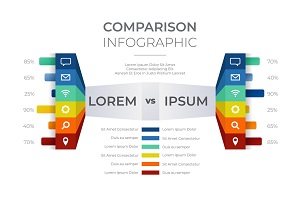
- Comparison infographics
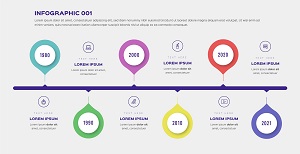
- Timeline infographics
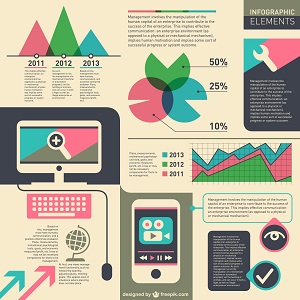
- Informational infographics
- List infographics
The respective information displayed in each type of infographic is unique in its own way. In contrast to a list, which often has just one column, comparison infographics will typically utilize two. Plan out the document’s structure ahead of time so that you know what to search for in a suitable template.
We are aware of the need to find a sample that either depicts a procedure or provides a means of demonstrating development. To make a comparison, you can’t use a two-column layout.
5- Organize Your Data Logically
Put the data you obtained in step 3 into order. It’s easier to make changes before starting to work on the design, so it’s best to do that first. If you want to get a bird’s eye perspective and be able to move data around easily, a Word or Google Doc format is what you need. Trying to do that after the graphic has already been created is a hassle. Talking over your outline is one method that might assist you in developing a more logical framework. Reviewing your outline and discussing it can help you see any weak spots in your reasoning.
6- Create an Infographic Template for Your Purpose
Only start from scratch while creating an infographic if you’re a seasoned graphic designer. Everyone loves to believe they have a good eye for design, but it takes practice to grasp what works and what doesn’t.
A decent design won’t guarantee your infographic’s success, but a lousy design that distracts from the content is doomed to failure. A well-structured infographic with a mediocre design will perform better than a well-designed infographic about yourself that goes nowhere.
That’s why I chose a sample and tailored it to your requirements. You can also hire a logo designer to do the heavy lifting for you. Additionally, you don’t have the time to start from scratch and make a high-quality infographic. You probably have a million other items on your to-do list.
To create the structure you want, start with a template that comes close and then tweak it to perfection. Modify it by, at most, copying/pasting, reordering, and altering the style of its components (fonts, colors, etc.). Infographic designers allow you to create a new look with no effort quickly.
Modifying the color scheme
The mood of your infographic may be affected by the colors you choose. Infographic designers are also expert photo editors who can lead you to choose the right infographic colors. If you want your infographic to seem lively and fun, choose colors in the bright and cheerful spectrum.
Remember why you’re communicating and the message you want to send. While discussing a serious issue, you shouldn’t use happy and bright colors.

Formatting the text and fonts
The typefaces used to write anything may have just as much of an effect on the reader as the choice of color. If you use the incorrect one, the whole meaning of your message might be altered.
It takes skill to recognize the difference between font and typeface and choose complementary typefaces. Also, you can consider hiring an online writer to better choose the formats for you. They ensure the infographic template you choose is compatible with the words and fonts you want.
Including pictures and symbols
Text alone in an infographic layout is dull; thus, visuals like photos and symbols are required. Images and symbols are particularly vulnerable to mistakes while working with templates because of the wide range of customization options they provide. You may utilize color and font choices to compensate for your inexperience.
7- Share, Download, or Embed Your Infographic
After finishing your infographic, you can save it as a PNG or PDF and distribute it through email or social media. If the infographic about yourself contains connections to other sites, it would be detrimental to download the picture instead of using the link provided.
Put your infographic on your website by embedding it. Go to the “share” tab, check the box to “make your infographic public,” and then click the “view embed code” button. To implement, just copy and paste the code onto your website. Putting the code in an HTML block is necessary if you wish to incorporate it in a WordPress blog post.


Howdy very nice blog!! Guy .. Excellent .. Amazing .. I’ll bookmark your blog and take the feeds additionally?KI’m happy to search out numerous helpful info right here within the put up, we want work out more techniques in this regard, thanks for sharing. . . . . .
Hi, Abel! Thanks for reading and for your kindness😊